I find tournaments fascinating.
In grade 11, I played on a club volleyball team called Pakmen 17U. After playing many tournaments over the course of the season, we arrived at the Provincial Championships. It was a 3 day tournament with 20 teams. This was when I was first introduced to the concept of a “power pool”.
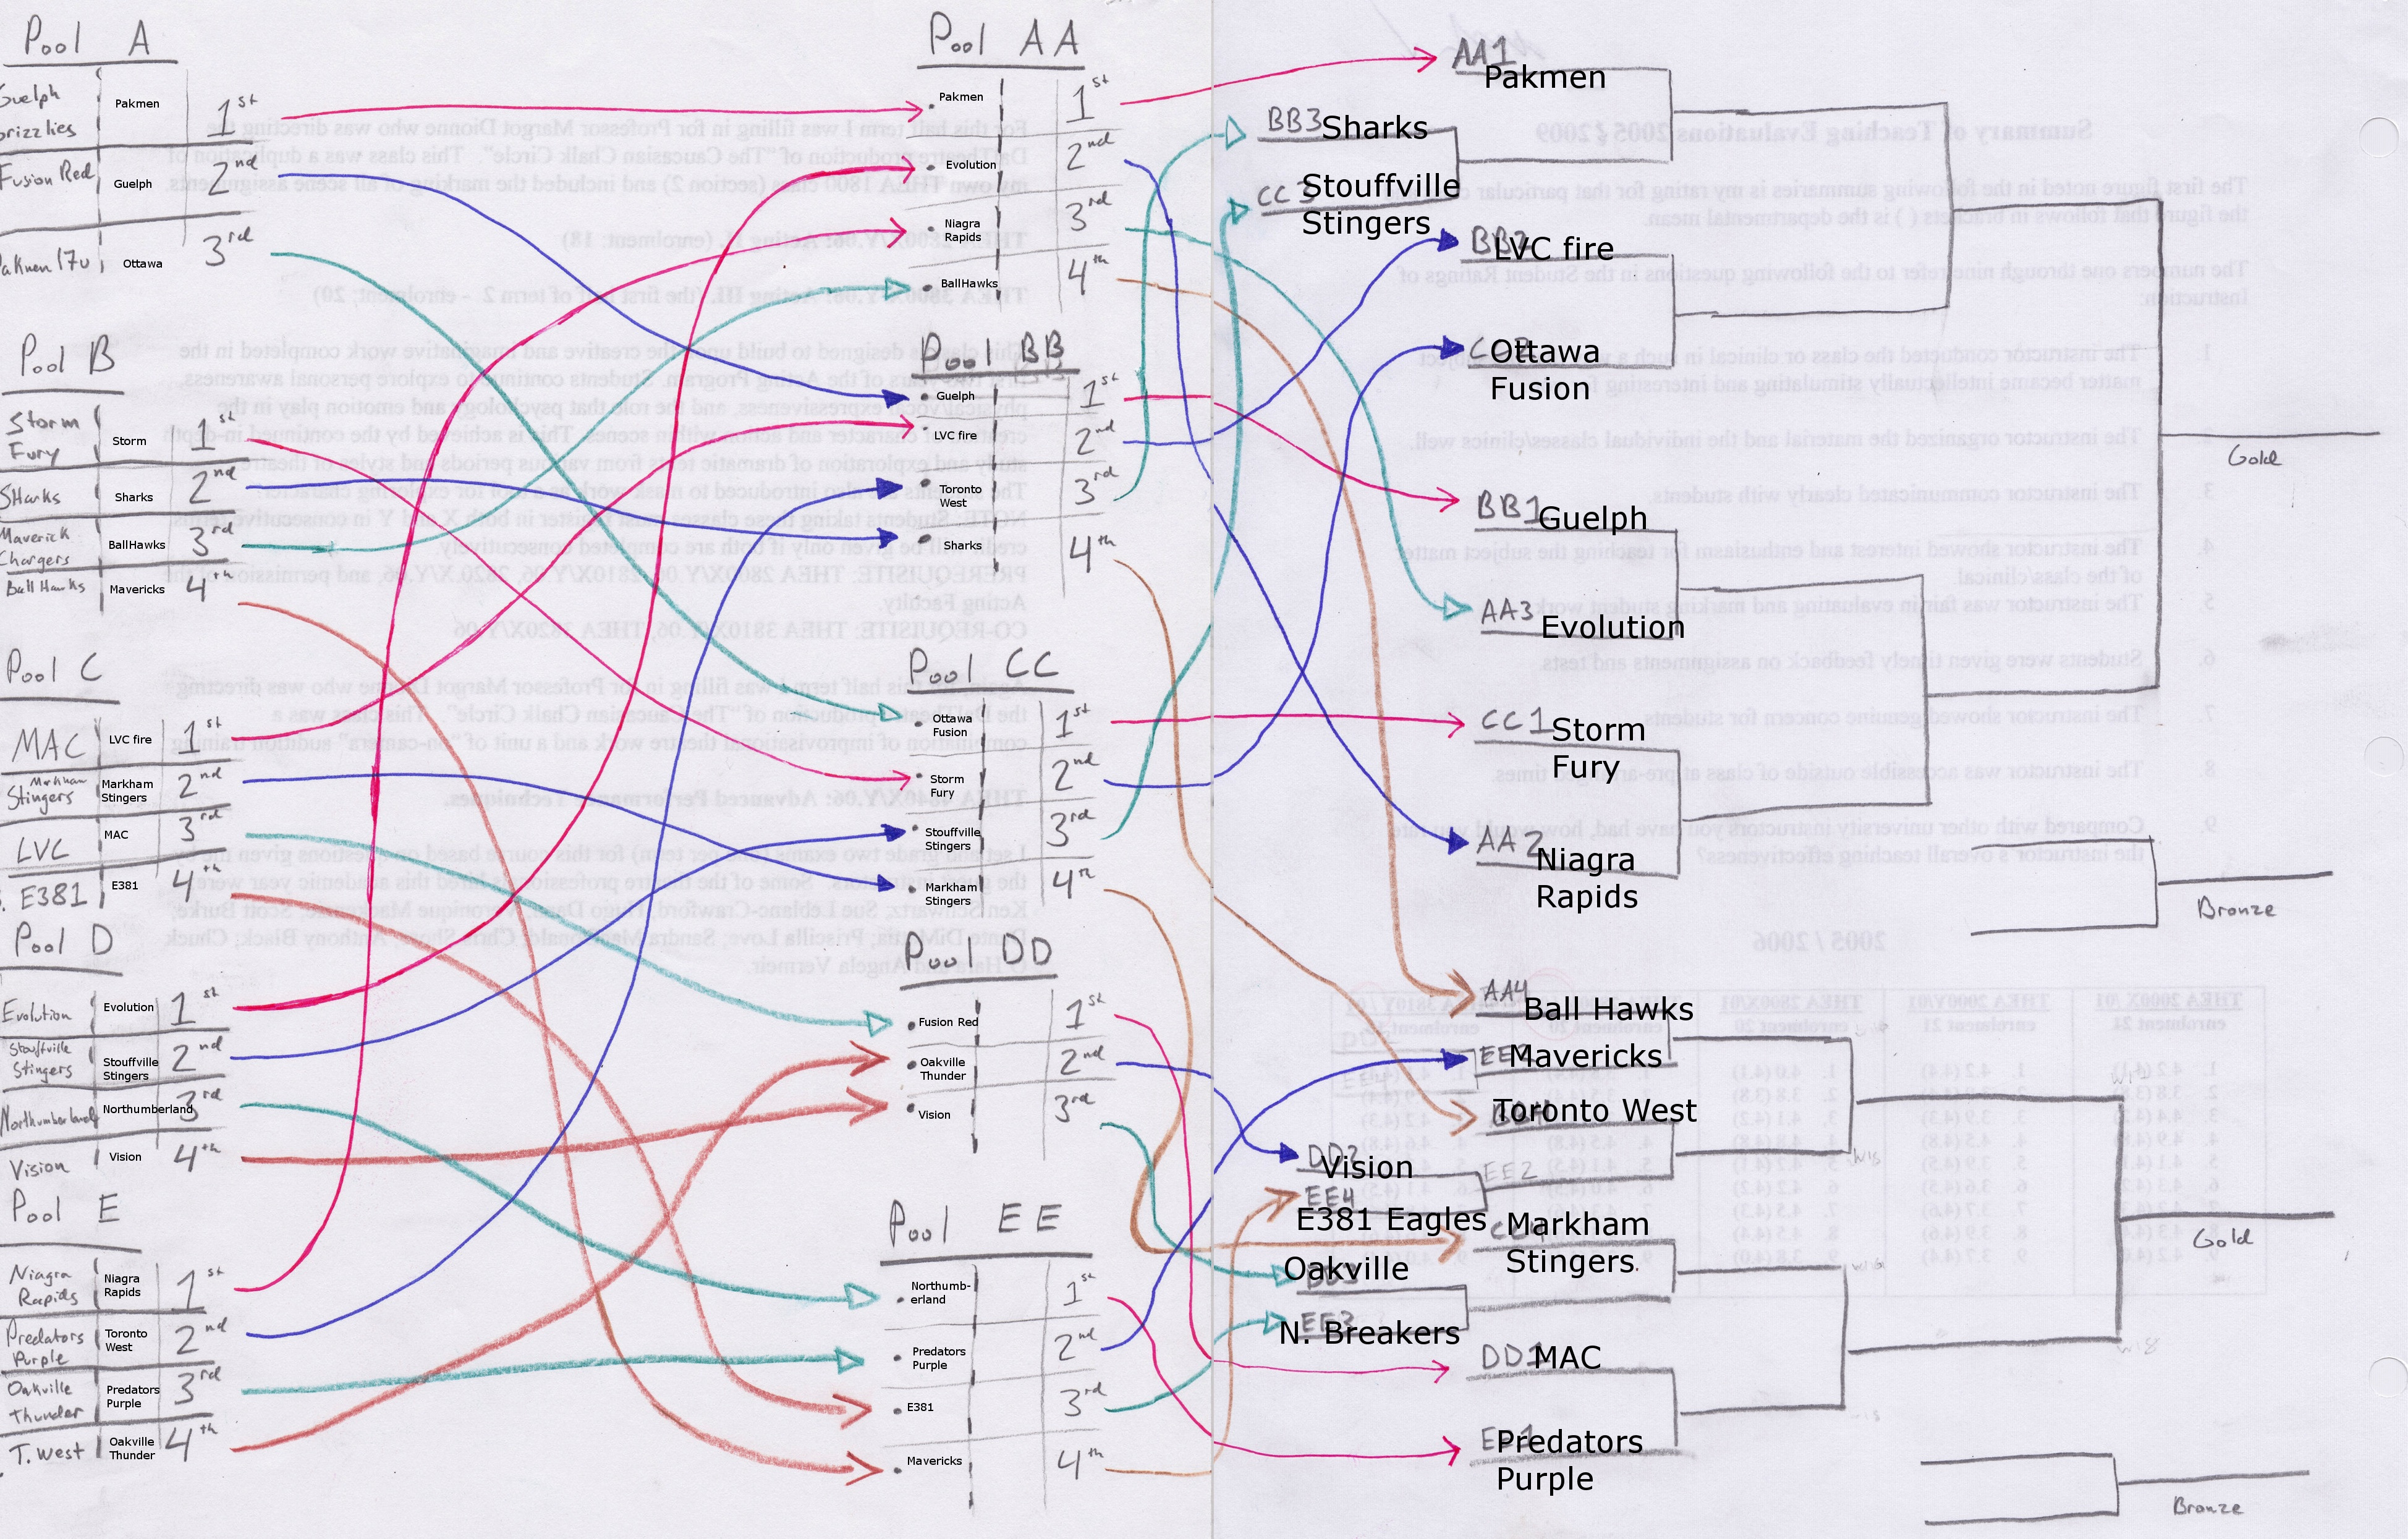
On day 1, there were 5 pools of 4, with a regular round robin. Depending on how you finished in day 1, for day 2 you were put into a new pool (power pool) and played another round robin. How you finished in the power pool round robin determined where you would end up in the playoff bracket(s).
The rules for defining who goes where were hard to read, and harder to follow as the tournament went on. So I drew a graphical representation of the tournament flow.
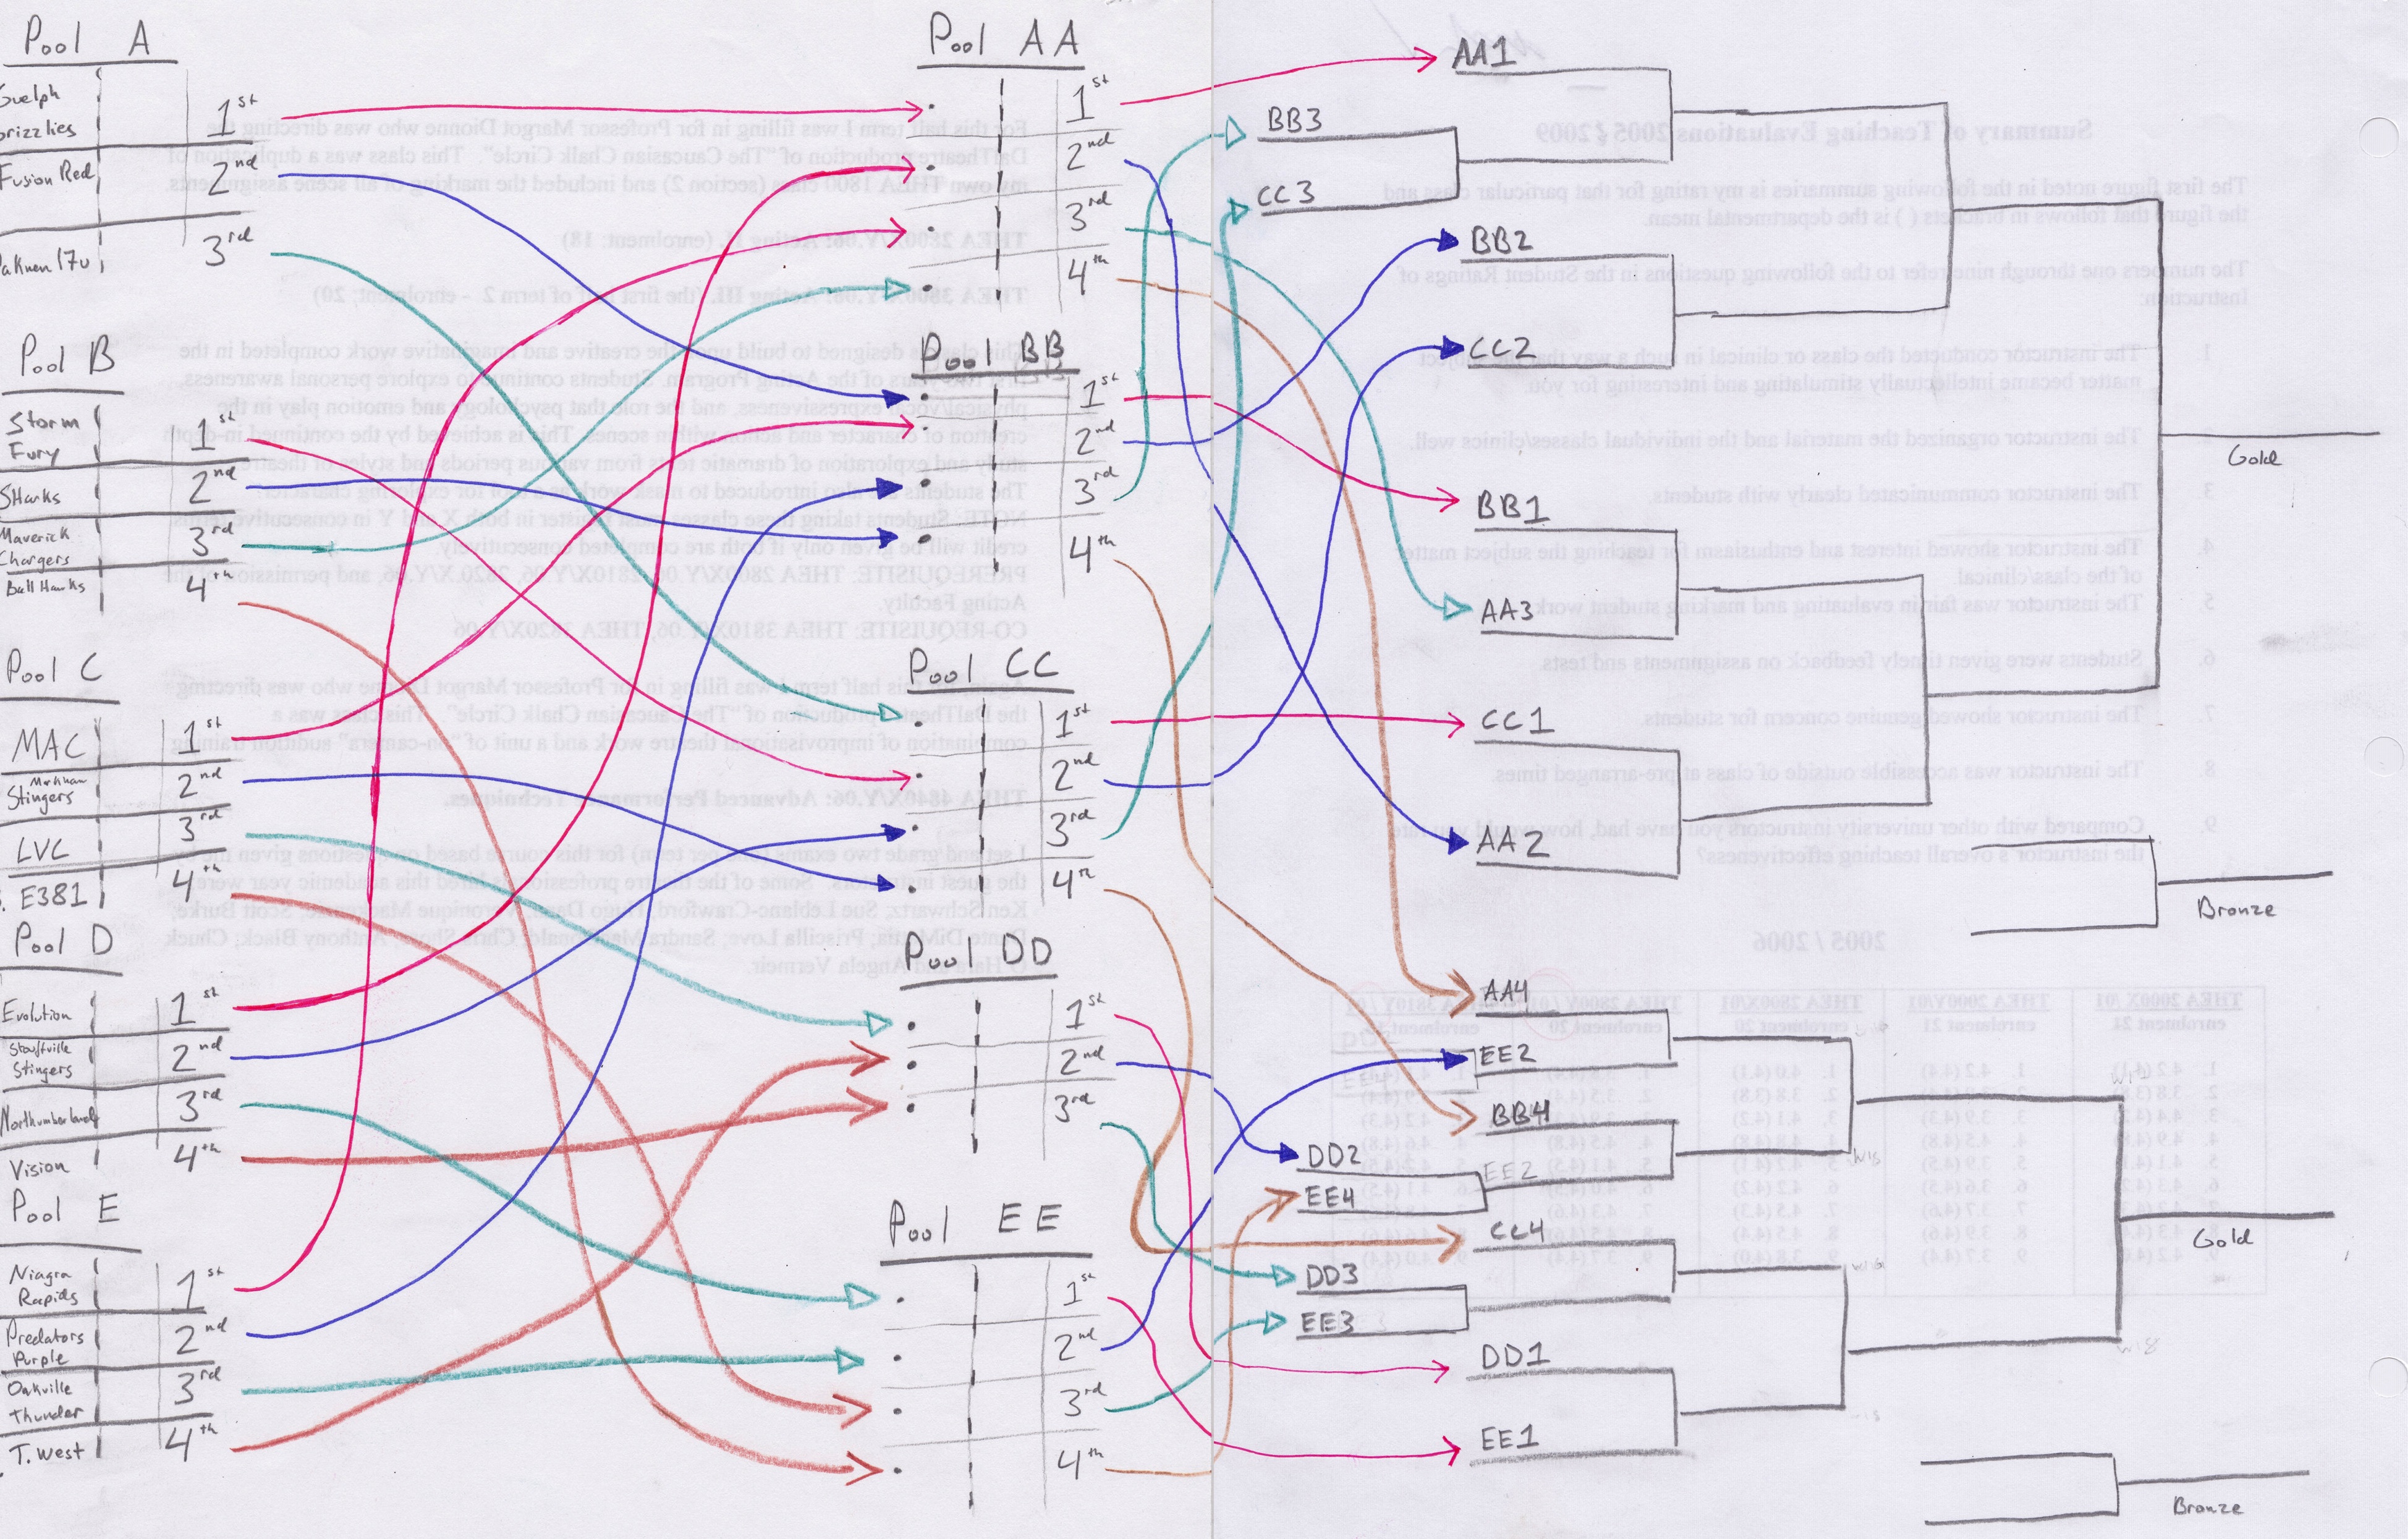
Colour was used to indicate the position in each pool, with the first place team’s line coloured red, second blue, etc.
All in all, this graph made navigating the tournament so much easier. After every day I updated the graph so we could have an accurate snapshot of who was going to play who, and who we might need to scout.
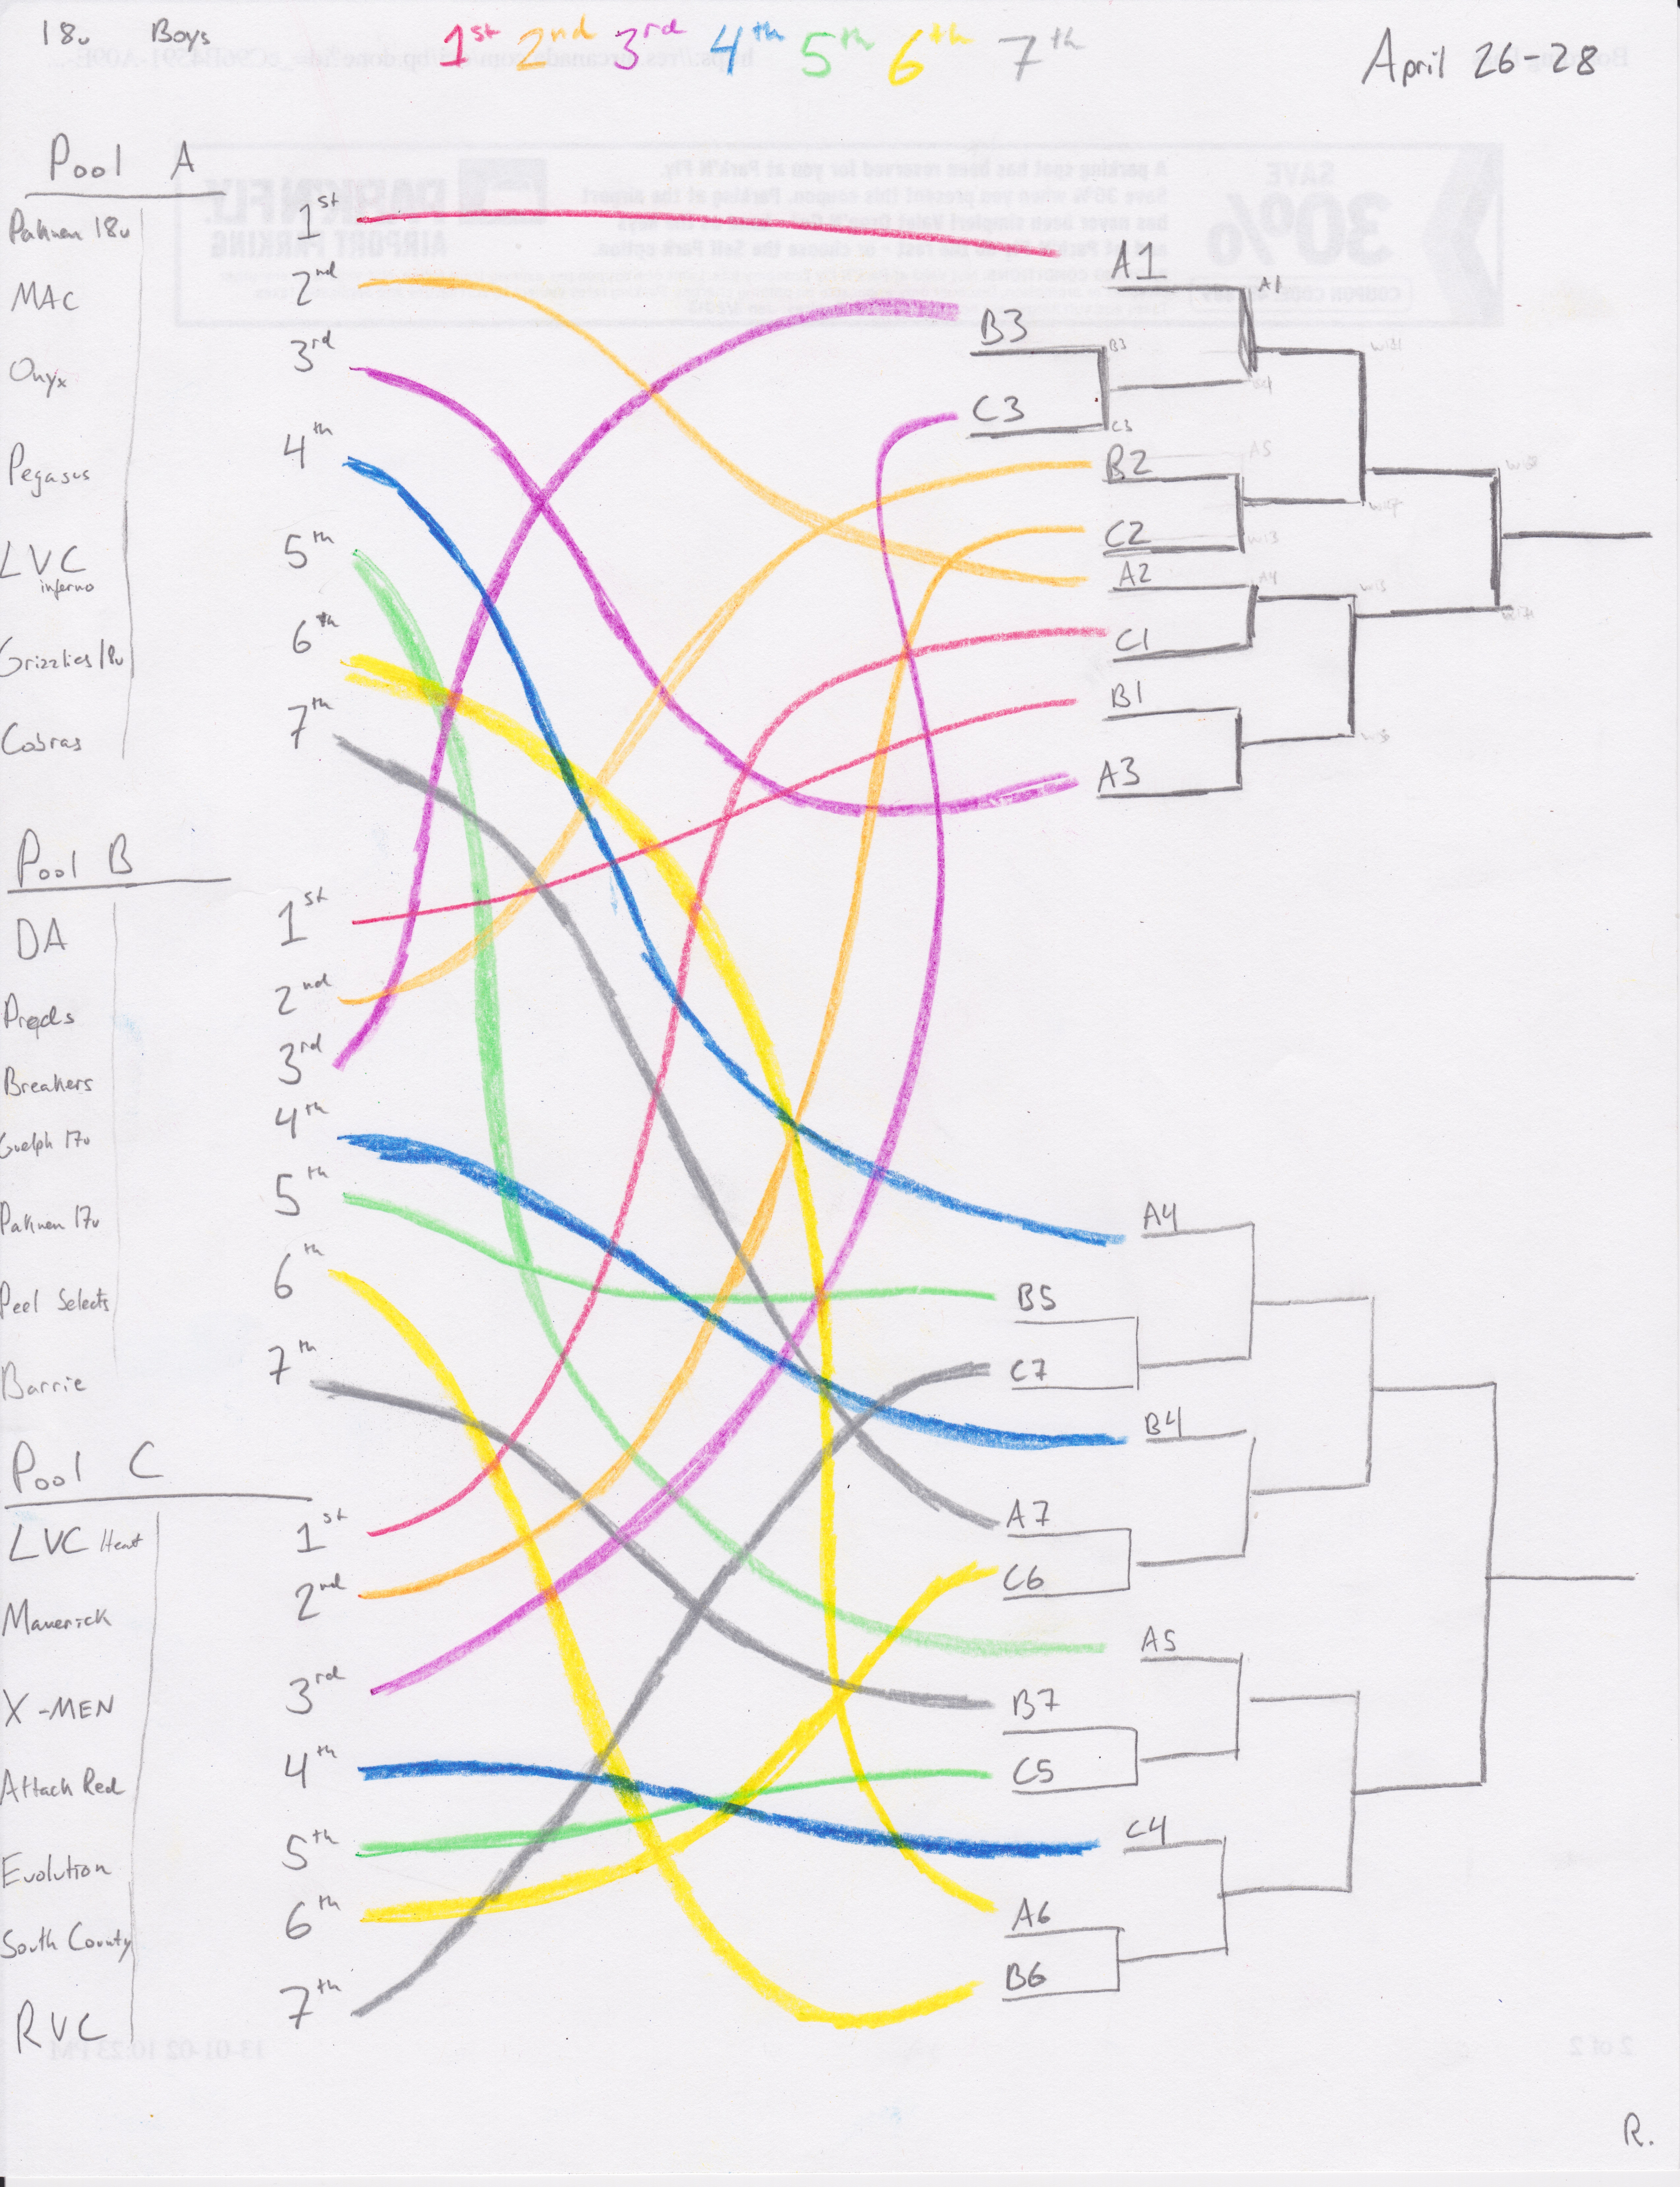
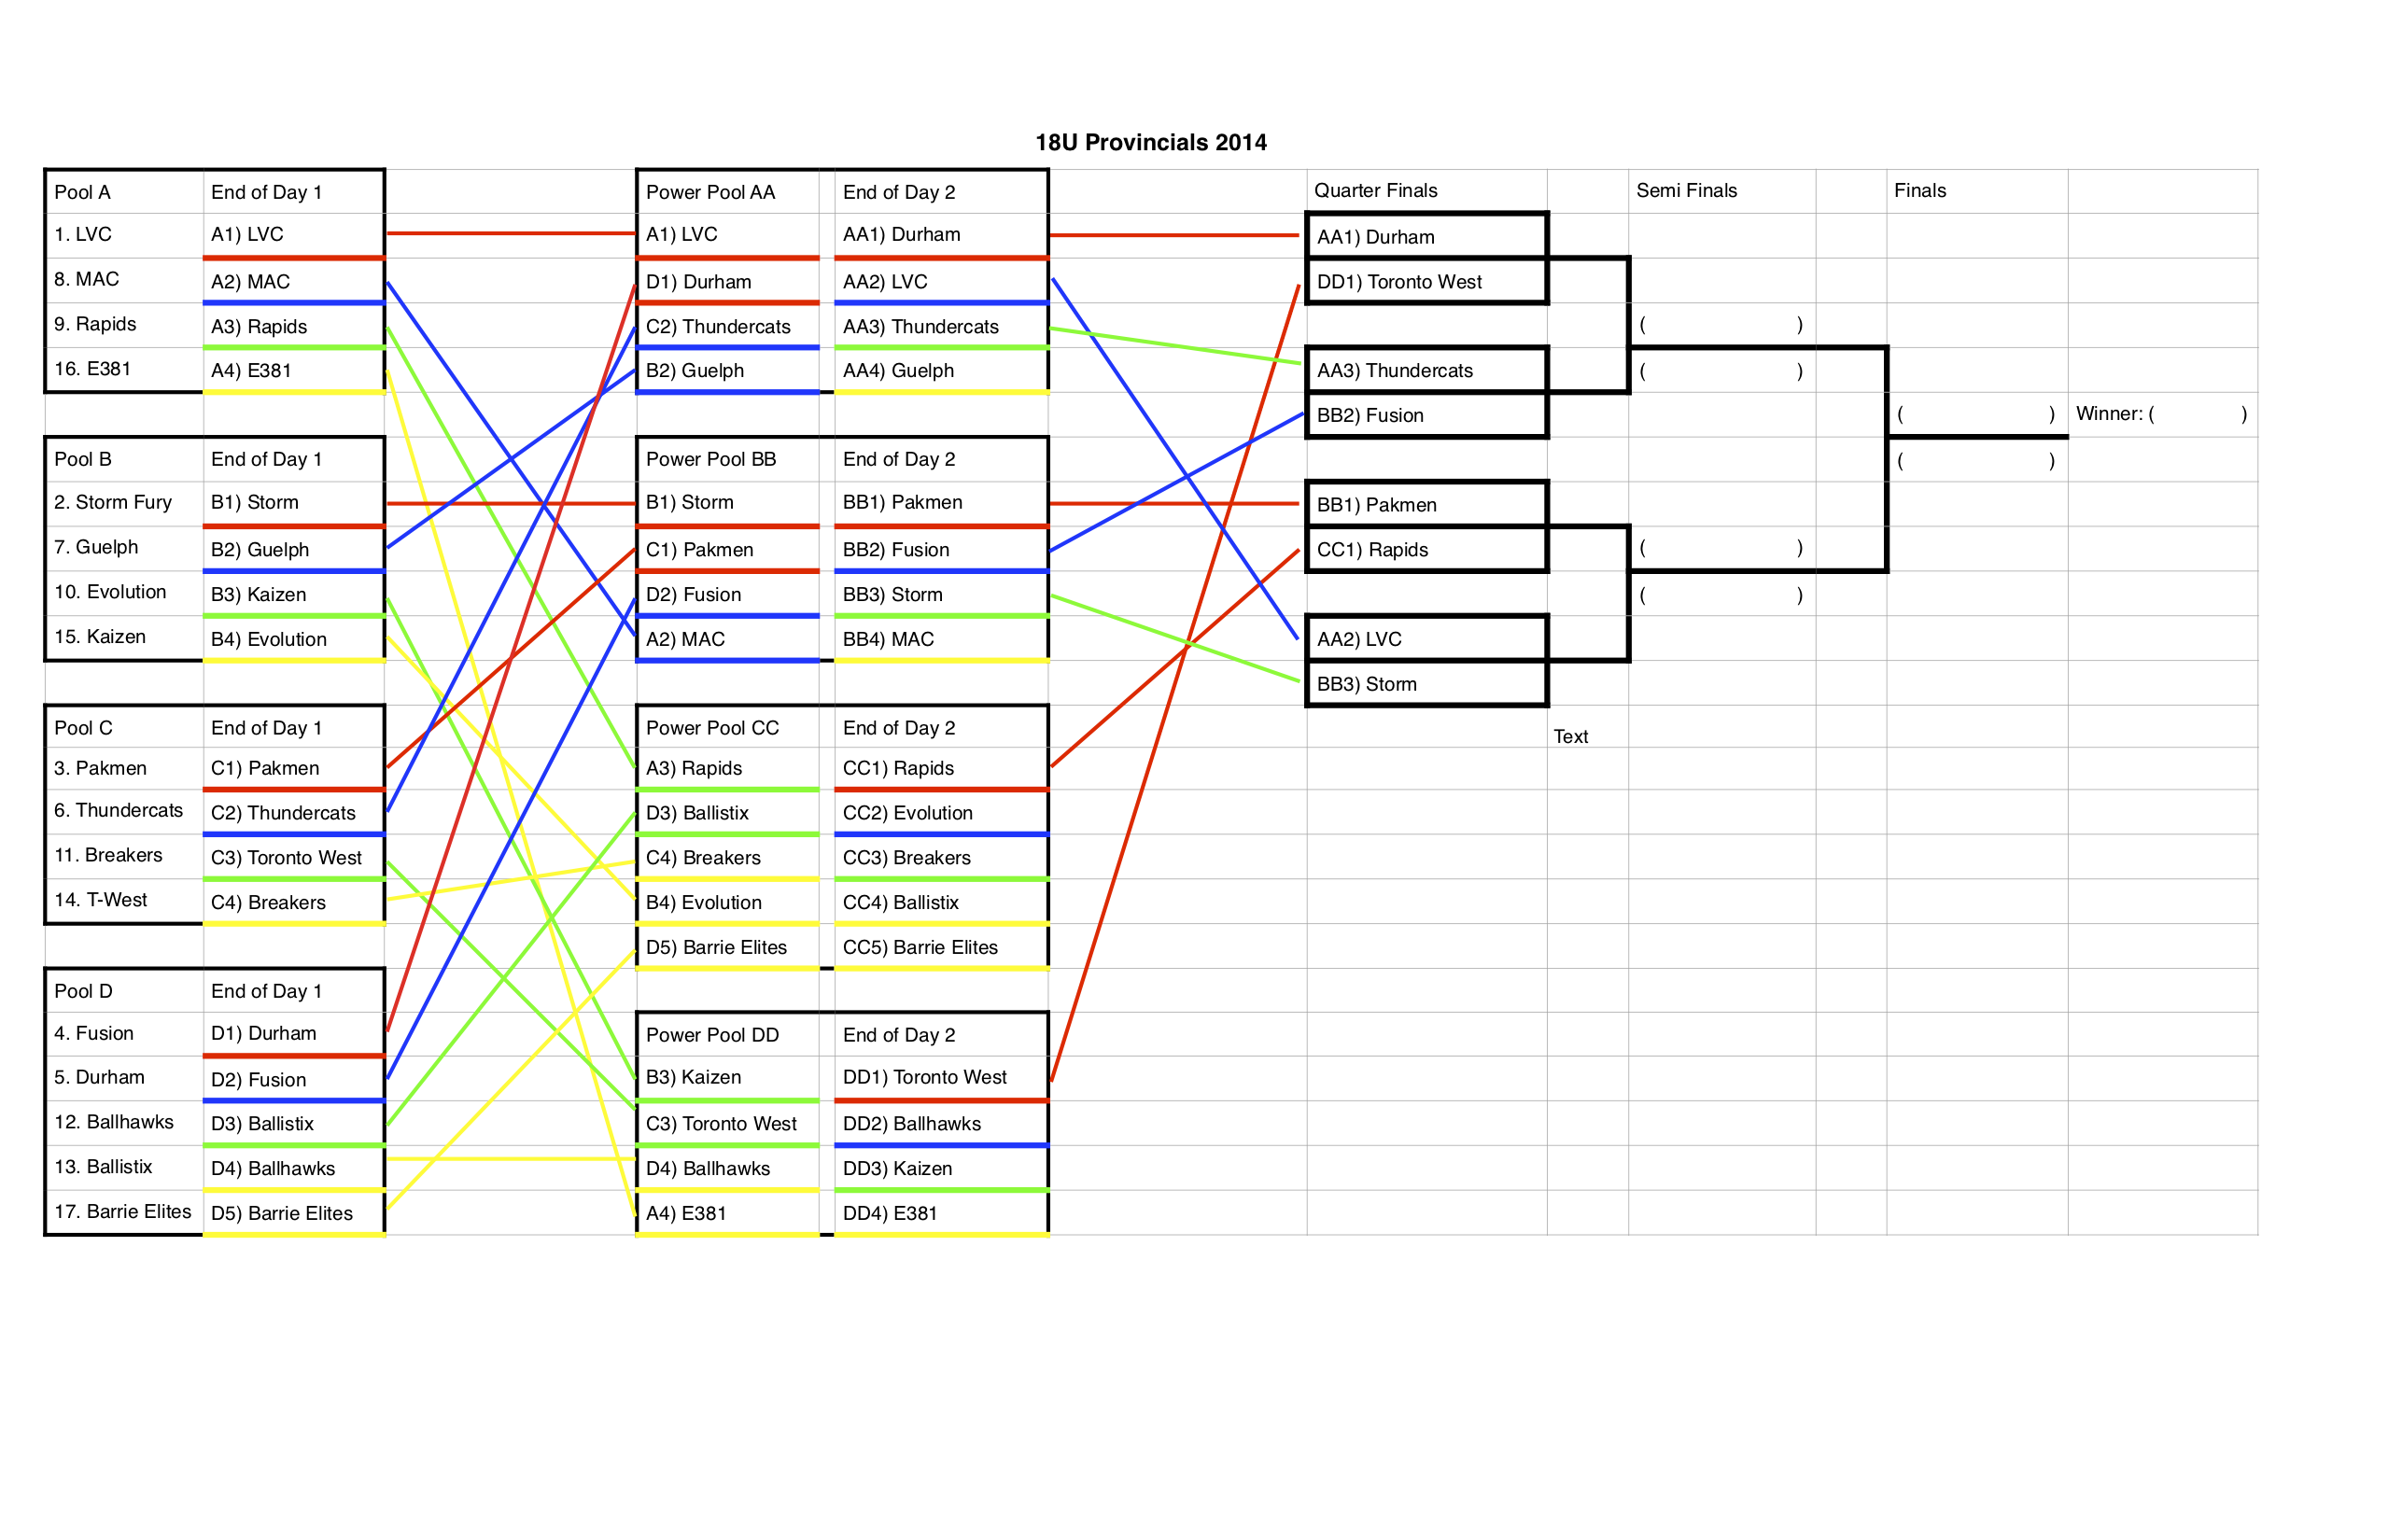
One week later we were back at RIM Park for 18U provincials. Even though there were fewer teams, I decided to also map out this tournament too.
One year later, we were back at RIM Park for 18U Provincials, but this time we were an 18U team instead of playing up a year as a 17U team. I had learned that drawing tournaments by hand took too long and was a wee bit messy, so I opted to use Numbers instead.
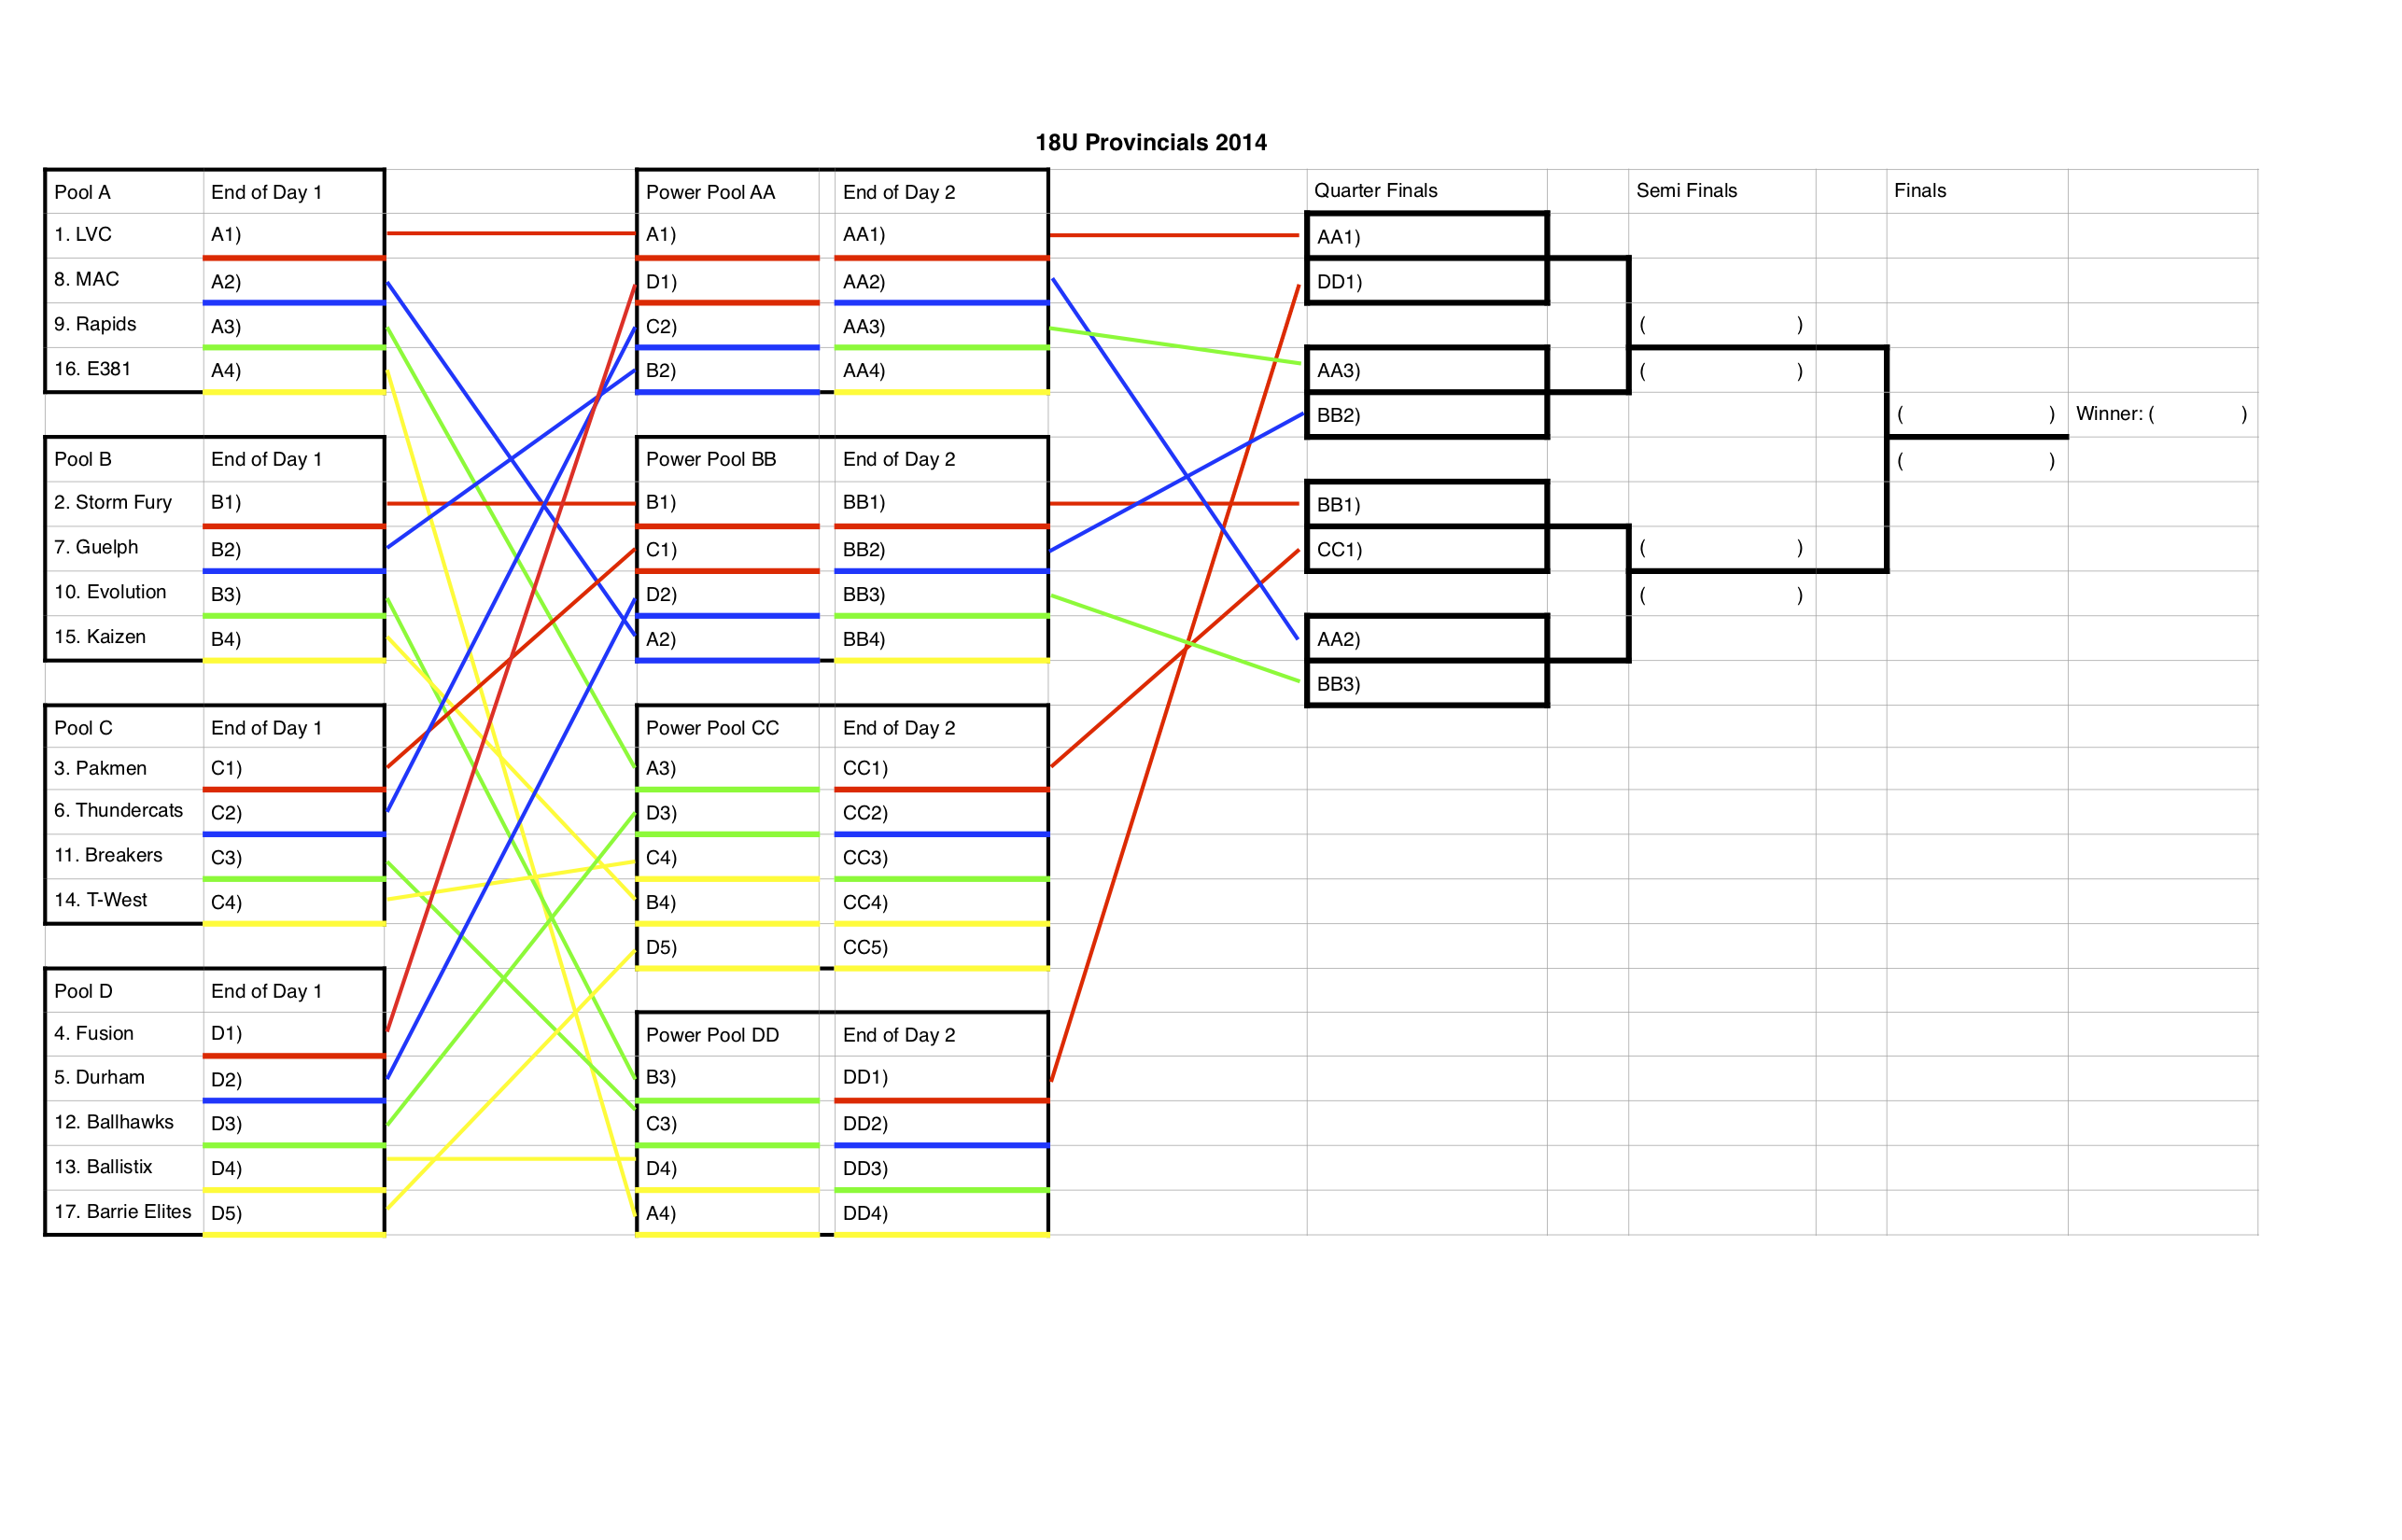
I’m not sure why I didn’t include the Tier 2 playoff bracket. But as it turned out we only needed Tier 1.
After 18U Provincials, there was only one tournament left in my club volleyball career: 18U Nationals. When the tournament schedule came out I sat down and got to work. Not only did I include the full touranment schedule, I colour coded each team based on their province.
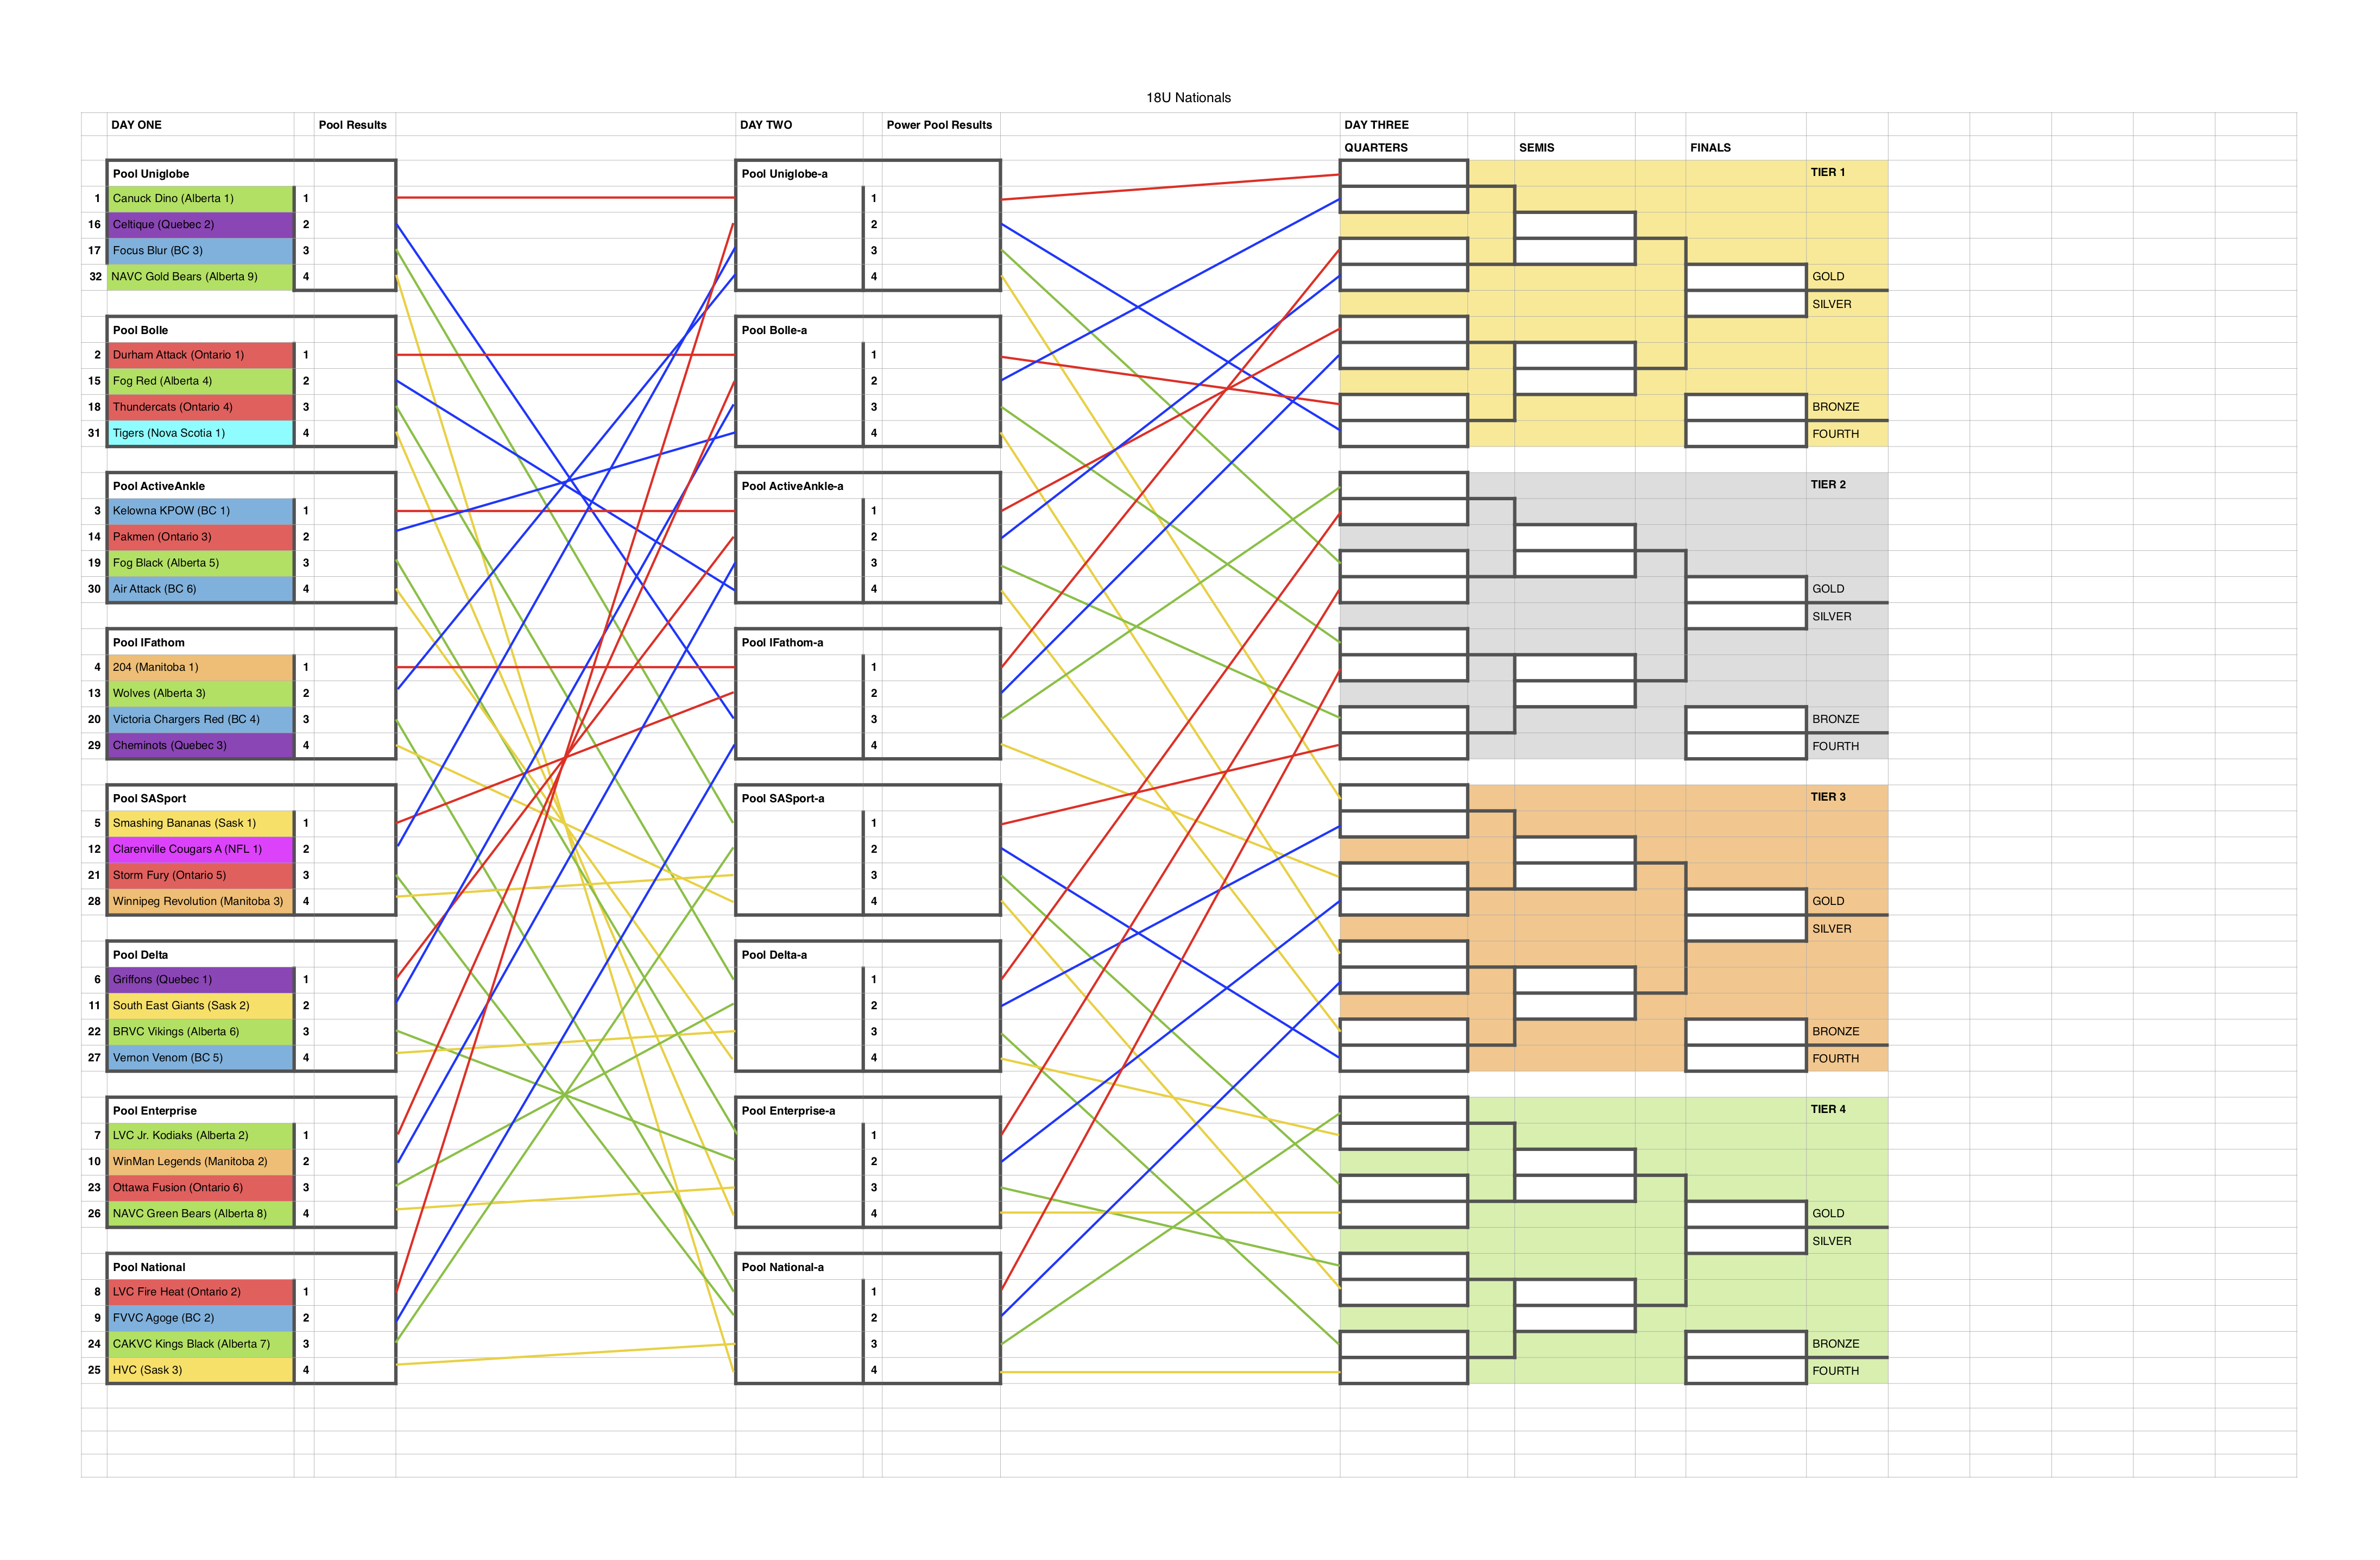
One thing to note about any tournament design is how it was seeded. The official seed number are indicated in the left most column of the spreadsheet.
We had a pretty good run, but unfortunently lost in the quarter finals.
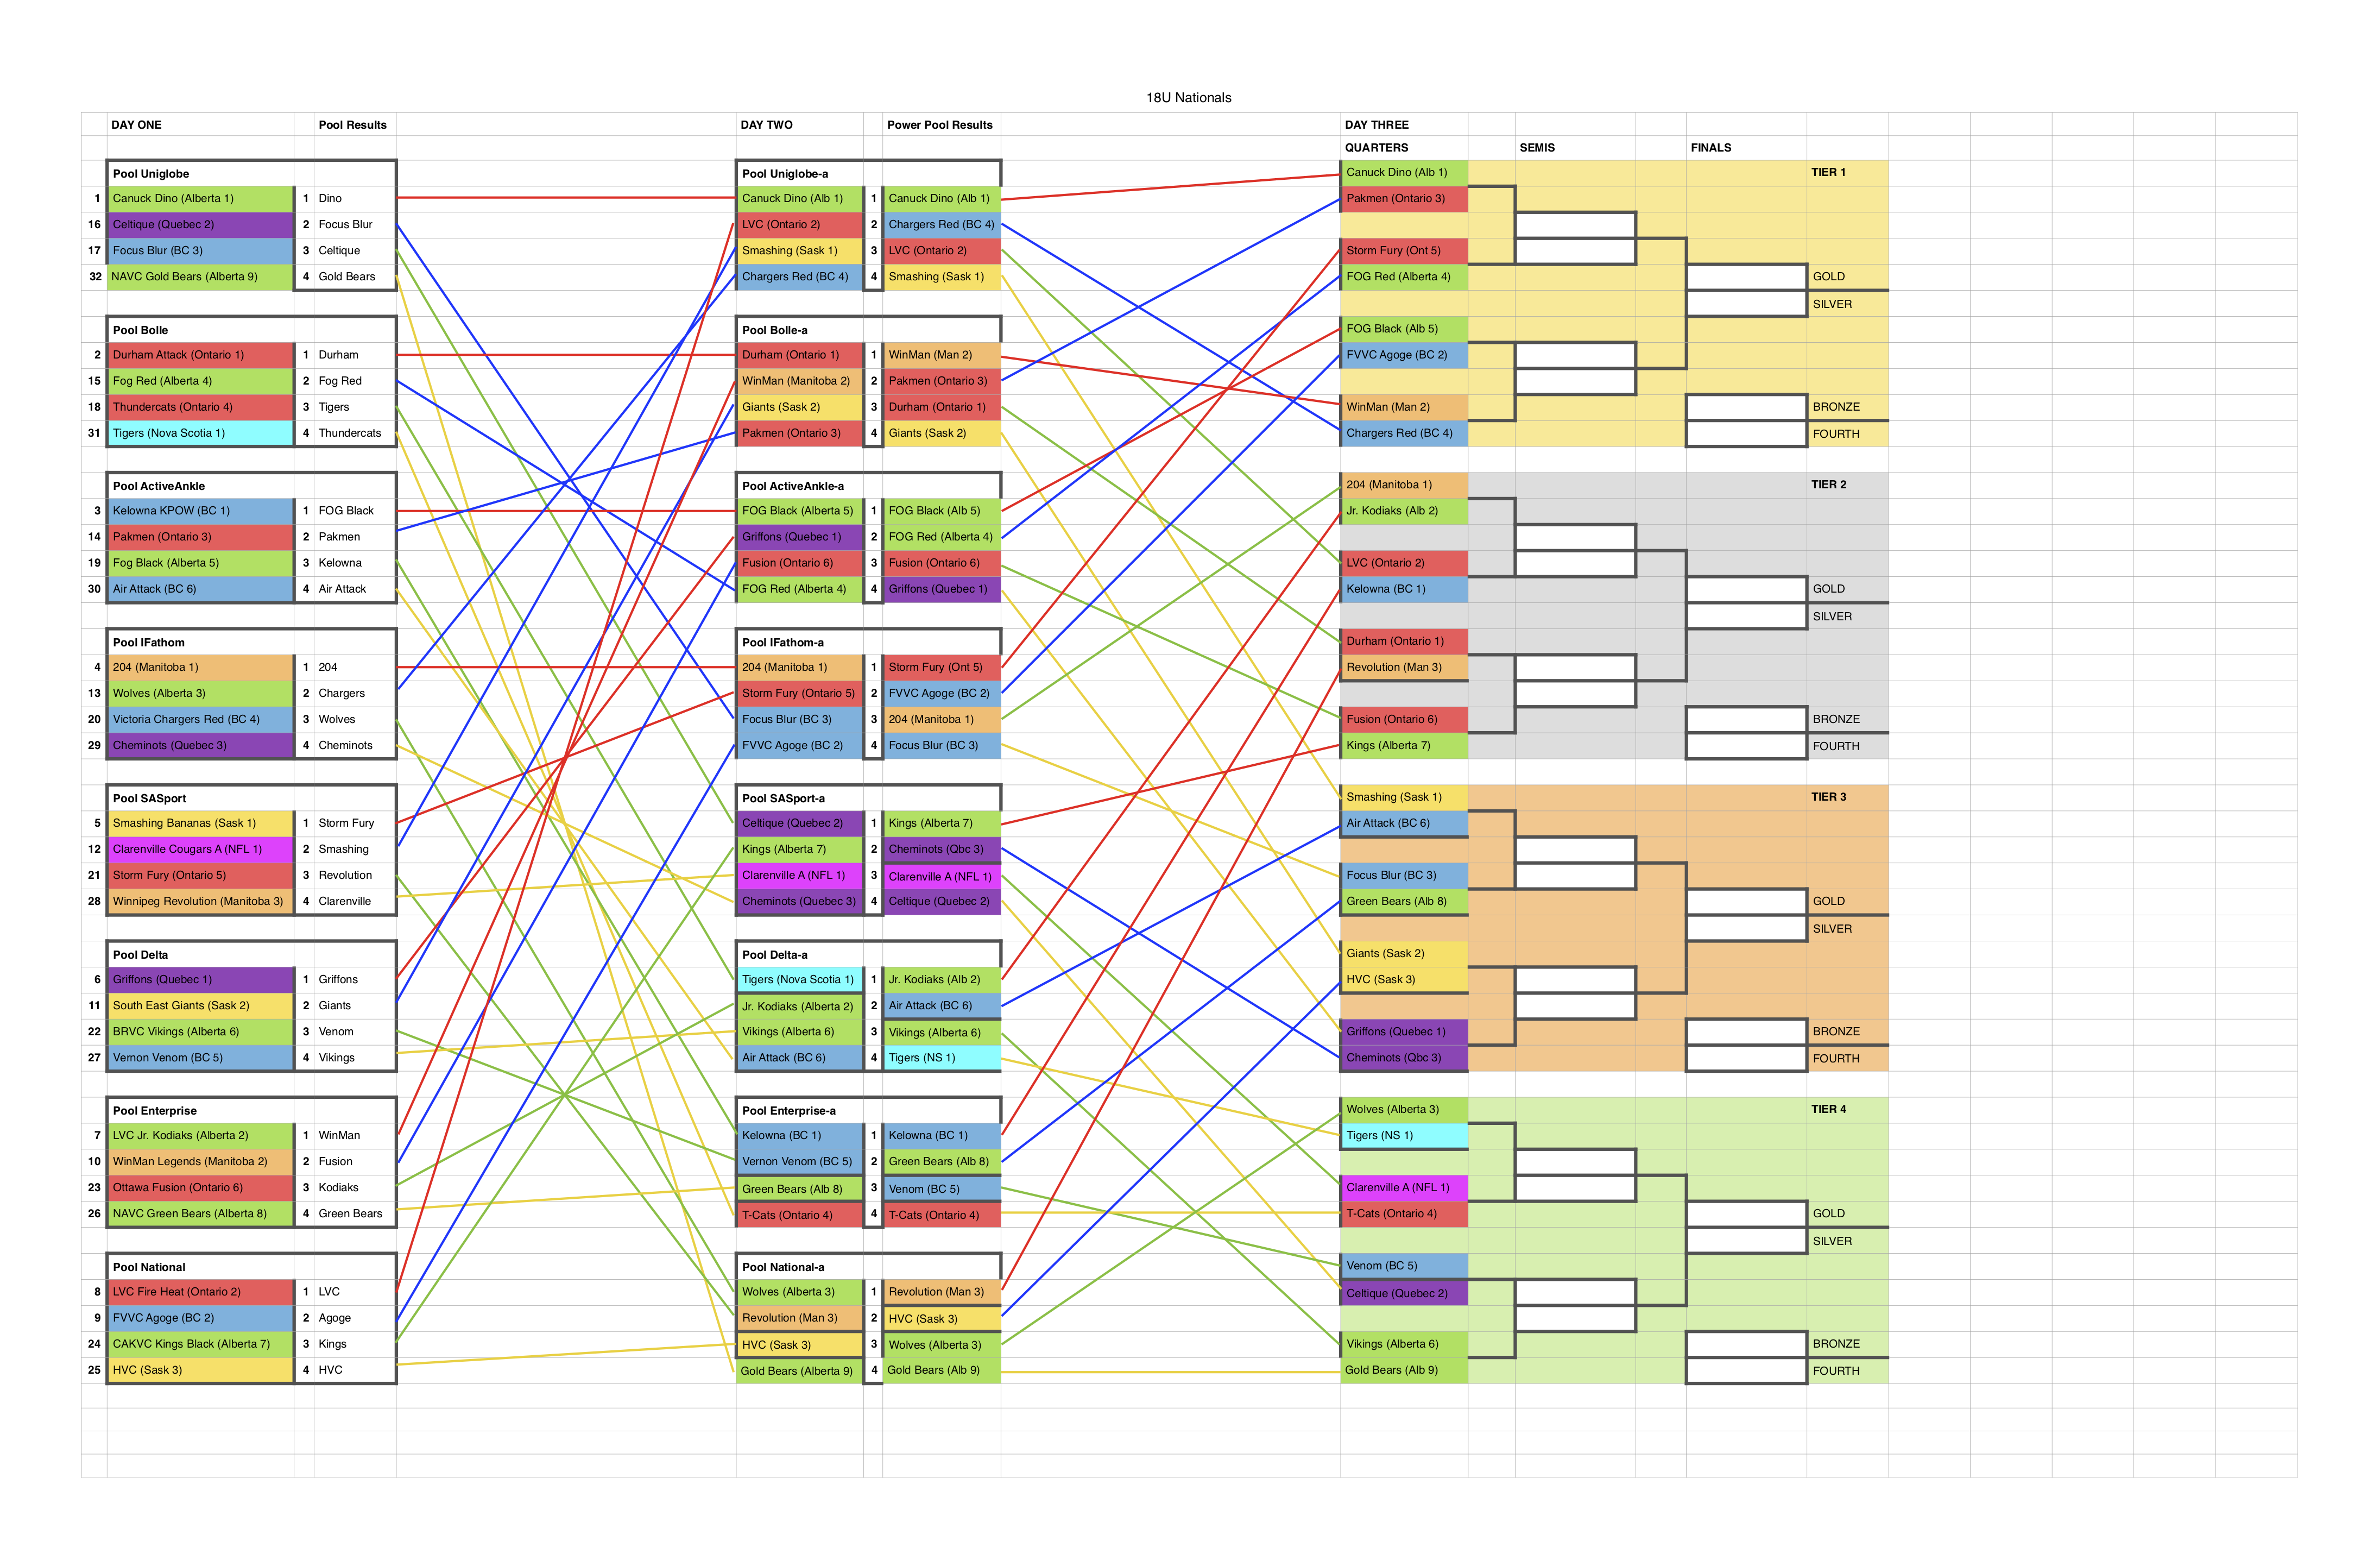
The most interesting thing about these flow charts, is that every line was carefully chosen to produce the most “fair” results. That is to say, if every team seeded 1 through N always beat teams with a lower seed than them, then the tournament should end with the #1 seed winning, the #2 seed in second, all the way down the line.
However this rarely happens because upsets are a thing, but the fact that the tournament is designed like the would have the two best teams meet in the finals instead of the quarters or semis.
At the end of the day the tournament design reflects the goals of the tournament. For Provincials and Nationals, they don’t only care about who wins it all, but how every team places along the way. This is why multiple tiers exist, so a team can walk away with a Tier 3 Bronze medal and know that they were exactly the 19th best team at Nationals.